Find out how you can digitalize your production
with solutions from MPDV!
Value Stream Mapping – Smart Factory Glossary
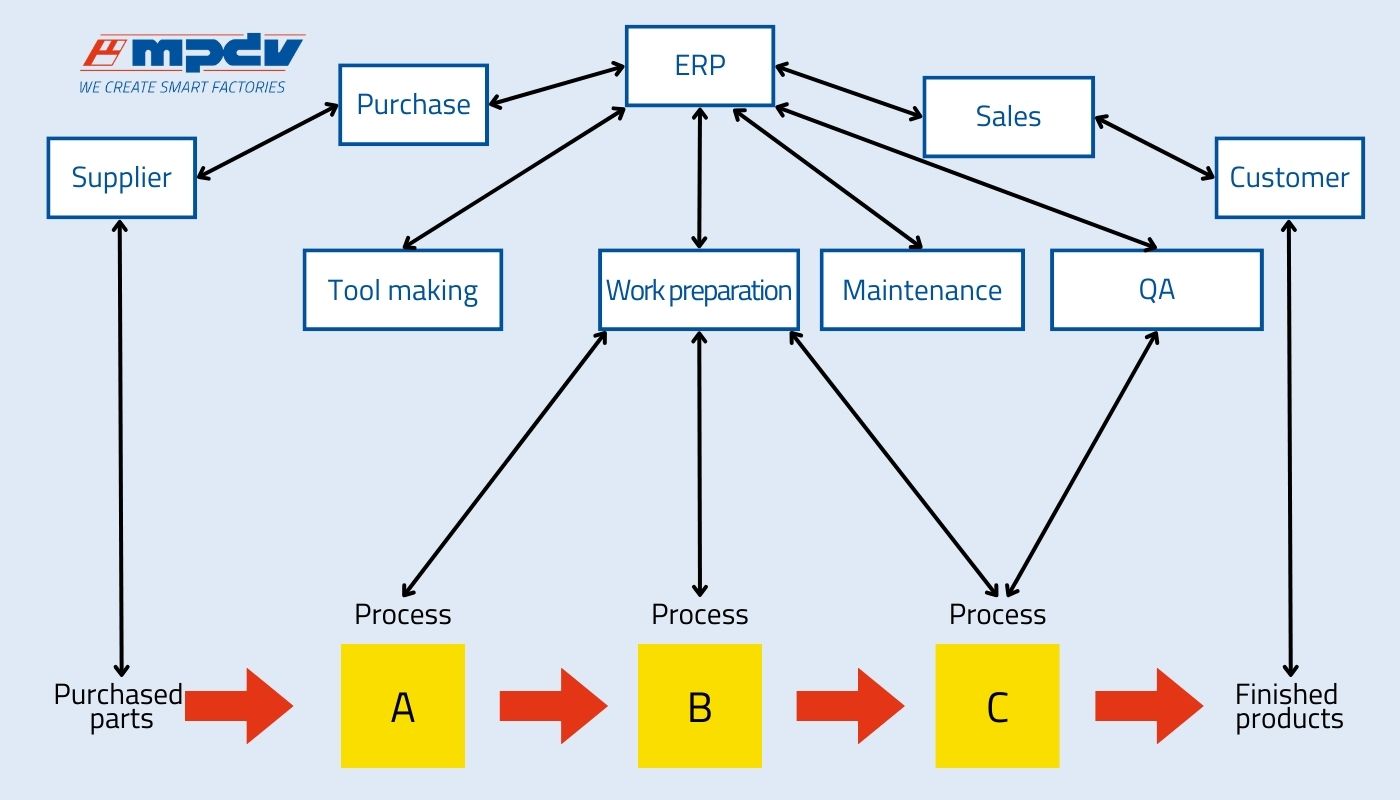
A value stream map is a diagram that visualizes the manufacturing process and material flow of a product as well as the associated information flows and planning processes of the value creation process. The value stream map includes all processes from delivery of the raw material up to the dispatch of the finished goods. The value stream mapping is also known as value stream design and value stream diagram.
The value stream mapping is part of value stream mapping, which is an integral method of lean management. The value stream analysis enables companies to gain an overview of their current production processes. Information is integrated in the value stream map to visualize it. The graphic display shows the current state of the production landscape and visualizes the dependencies between process steps, planning processes, information flows, and the IT systems used.
Objectives of the value stream mapping
The value stream mapping shows the entire complexity of production in every detail. The aim is to discover weak points, identify waste in processes, and determine potential for improvement. The structured mapping of the value stream uncovers non-value-adding activities such as waiting times, storage times, unnecessary movements, or overproduction.
The next step is to convert the current status into a target concept. It shows how the value stream can be improved: The weak points are specifically eliminated, future processes are defined and supported with suitable functionalities of a Manufacturing Execution System (MES). An MES specification sheet is created for this purpose, which is derived from the target concept and lists the exact requirements for an MES.
Elements of a value stream map – examples
- Supplier and customer information: Suppliers and customers are included at the beginning and end of the value stream design.
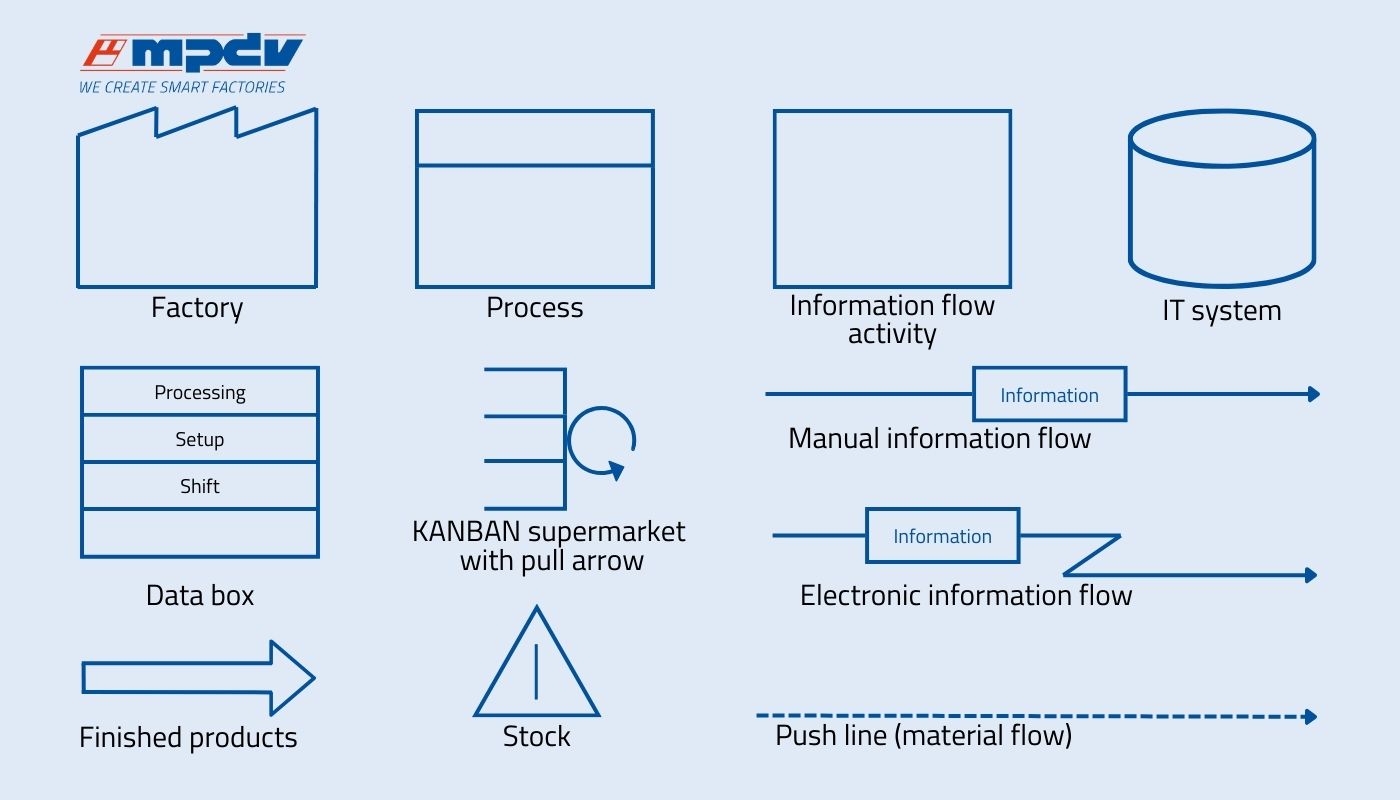
- Processes: Each process step is shown as a box, with the steps arranged in the order they are to be performed.
- Material flow: The physical flow of materials along the process is visualized with push lines. The dashed lines indicate that the manufactured parts or intermediate products are moved to the next process step.
- Information flow: The information flow required for the process is shown with arrows. A straight arrow line illustrates the manual transfer of information, for example as a note on paper. A jagged information arrow visualizes the electronic data transfer. The information flow includes, for example, order information, production plans, or customer requirements.
- Time information: Details on throughput times, waiting times, and idle times help to identify bottlenecks and wasted time. The separate times are visualized in a timeline. The line ends with a box showing the total of the times. The actual processing time is therefore quickly visible.
- KPIs: KPIs such as cycle time, shifts, or stock quantity are often integrated into the value stream mapping in a data box.
MPDV supports value stream mapping and analysis
Experts should be consulted for the creation of a value stream map and for the preceding value stream analysis. The Executive Manufacturing Center (EMC) specializes in lean management and pursues an integrated approach. This involves looking at the entire value stream 4.0, in other words the interaction between production, administration, and the IT landscape. In this way, consultants can reduce the complexity of processes and simplify everyday working life. MPDV offers with the Manufacturing Execution System (MES) HYDRA X and the Advanced Planning and Scheduling System (APS) FEDRA suitable software to digitalize processes and information flow in production.
Would you like more information? We are happy to help.
Just fill in the form below. We will take care of your inquiry promptly.

